Free YouTube Embed — Variant Reach Funnel
Date range: 06/13/2026 – 06/29/2026 · 466 sessions · Source: Microsoft Clarity — one export per visited-URL filter
How this funnel is built
/y/"). So a step's number is how many sessions reached that page — a real reach count. The watch itself happens on the /y/ pages (the free embed); those pages have no Play event, so /y/ reach — not the Play metric — is the watch signal.
Reach funnel — % of home visitors
Bars are share of the 391 sessions that reached the home page. These are overlapping reach sets (a watcher is usually also counted in home/content), ordered by size. Counts come straight from the per-segment exports.
/y/ watch page — the free embed. Reaching the watch step is the bottleneck; engagement once there is very high (see below).
Same funnel, by unique users — % of home users
The funnel above counts sessions; this one counts unique users (a person who came back across two sessions is counted once). Bars are share of the 330 users who reached the home page. Same reading as above: right label = [users who reached the page] · [% of the 330 home users]; red line = home users who did NOT reach the next page.
Engagement deepens at every step — active and total time
Each row is that segment's own averages. The further into the funnel a session gets, the longer it stays and the more it browses. Total time (full session length) climbs even faster than active time.
| Reached… | Sessions | Users | Pages / session | Active time | Total time | Scroll | Login |
|---|---|---|---|---|---|---|---|
| All variant sessions | 466 | 358 | 2.88 | 1:27 | 2:57 | 82.8% | 14.0% |
| Home | 391 | 330 | 3.10 | 1:34 | 3:10 | 82.2% | 15.6% |
| Campaign tag | 113 | 100 | 4.17 | 1:33 | 4:39 | 84.3% | 9.7% |
| Content /m/ | 172 | 135 | 5.19 | 3:11 | 6:03 | 87.6% | 13.4% |
| Watch /y/ | 45 | 39 | 8.33 | 6:00 | 11:40 | 86.8% | 2.2% |
Total session time climbs 2:57 → 3:10 → 4:39 → 6:03 → 11:40 (min:sec). Sessions that reach the free embed run ~4× the overall total time (11:40 vs 2:57) and browse 8.3 pages. Note login drops to 2.2% at the watch step — people watch the free embed without signing in.
Prior knowledge effect — email recipients vs cold visitors
Within the variant, one group received the "Watch for Free" email (campaign freech10, 150 sessions) — so they arrived knowing free watching exists. Everyone else (the variant minus that campaign = 316 sessions) entered cold and had to discover it. Same product, different expectation — does it change behaviour?
freech10 email/y/ watch pages than people who stumbled in cold.
freech10 · 150 sessions
Right-side label = [sessions that reached the page] · [% of that cohort's home visitors]; red line = home visitors who did NOT reach the next page.
The cold cohort is the whole variant minus the email cohort, computed step by step (so 150 + 316 = 466, and e.g. the free-watch tag = 113 total − 60 email = 53 cold). The free-watch tag tells the story: 40.8% of email recipients reach it vs 21.7% of cold visitors — the email lands people on the dedicated offer page.
Takeaway: prior knowledge clearly pushes people toward the offer. Email recipients reach the campaign tag /Watchforfree at ~1.9× the rate (40.8% vs 21.7% of home visitors) and reach the free watch page somewhat more often (13.6% vs 10.2%). Notably, cold visitors reach movie pages more (48.8% vs 36.1%) — much non-campaign traffic (aparat / Google) lands straight on a title — yet they convert onward to the watch page slightly less. So the email's strongest, clearest effect is funnelling people through the dedicated free-watch offer page.
Variant snapshot (all 466 sessions)
Why mobile — and is the homepage promo actually working?
First, why this whole report leans on mobile behaviour: 79% of variant sessions are mobile. So the mobile homepage is where the promotion has to land.
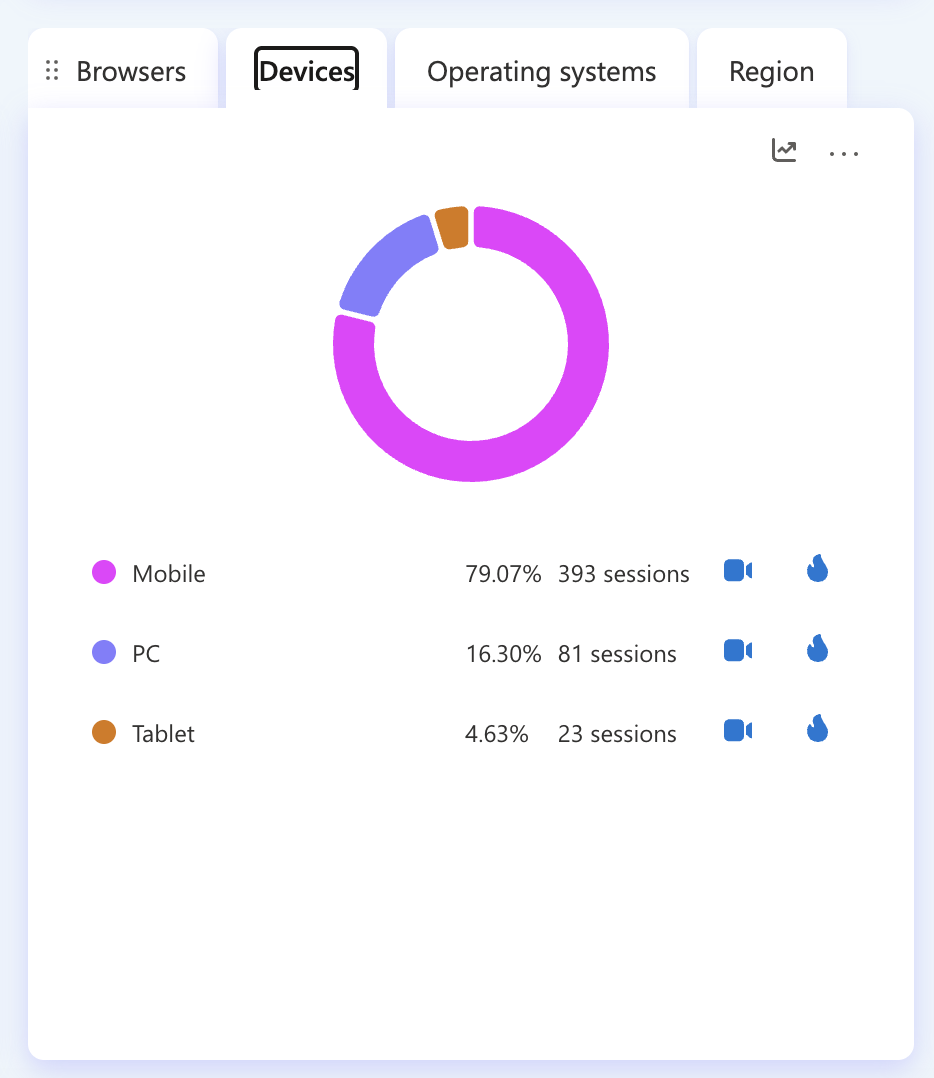
| Device | Share | Sessions |
|---|---|---|
| 📱 Mobile | 79.07% | 393 |
| 💻 PC | 16.30% | 81 |
| 📟 Tablet | 4.63% | 23 |
Nearly 4 in 5 sessions are on a phone — the promo's success rides on the mobile homepage.
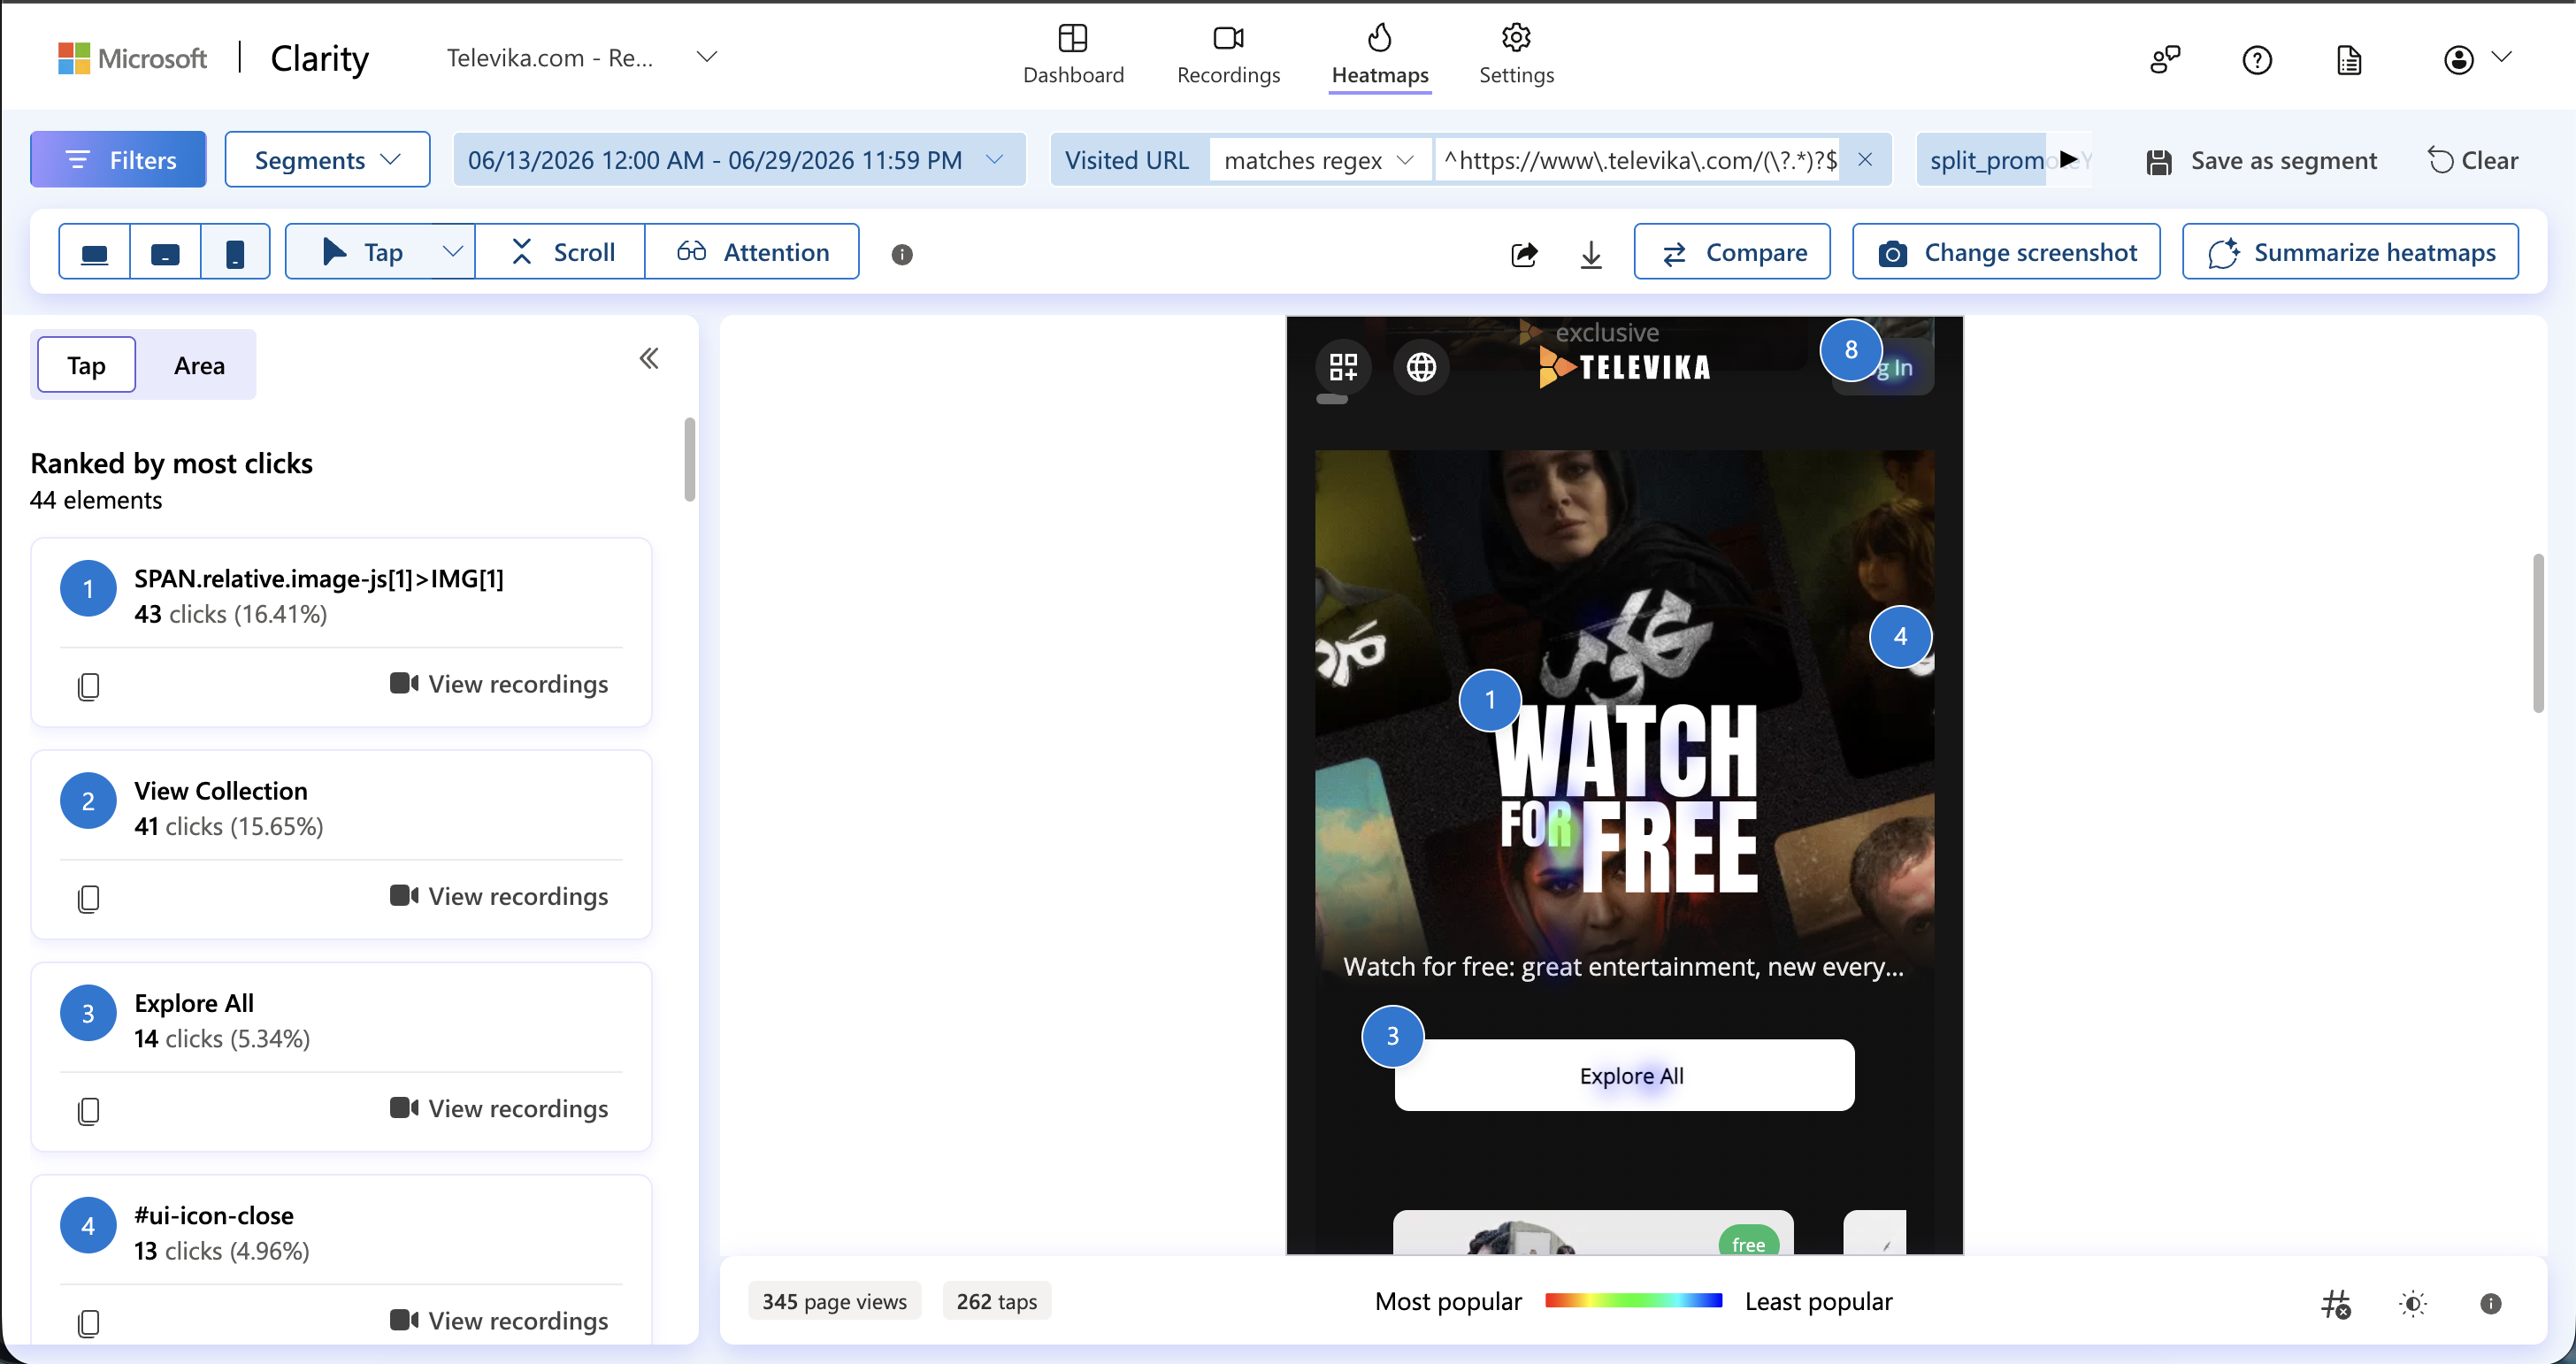
The mobile homepage click map answers it: the three most-tapped elements are all the "Watch for Free" promotion. Of 262 taps across 44 clickable elements, the top three are the promo block — the free-watch hero and its two CTAs:
| Rank | Element tapped | Clicks | Share of all taps |
|---|---|---|---|
| 1 | “Watch for Free” hero banner | 43 | 16.41% |
| 2 | “View Collection” button | 41 | 15.65% |
| 3 | “Explore All” button | 14 | 5.34% |
| 4 | (close icon) | 13 | 4.96% |

What this funnel says
The watch page is reachable but narrow
45 of 391 home visitors reach a /y/ free-embed page. The watch path works — but only about 1 in 9 home visitors travels it.
Reaching the embed = huge engagement
Watch-page sessions average 8.3 pages, 6:00 active and 11:40 total (min:sec) — roughly 4× the overall session. When the free embed is reached, people stay.
Content is reached more than the tag
More sessions reach a /m/ content page (172) than the campaign tag (113), so a lot of content reach comes from direct aparat/Google entry, not the tag flow.
Watchers don't log in
Login falls from ~15% at home to 2.2% at the watch step — the free embed is consumed without an account, by design.
Biggest drop is home → deeper
From 391 home visitors, 172 reach content and only 45 reach a watch page. Most of the loss is between landing and getting into a title.
Watchers see a faster page
The /y/ segment's LCP is 8.13s vs 11.25s overall — the people who get to the embed experience a lighter load than the cohort average.
Method & caveats
split_promoteYoutubeEmbed = variant, 06/13–06/29/2026 — one unfiltered (466 sessions) plus one per visited-URL filter: home ^…/(\?.*)?$ (391), content starts with /m/ (172), tag /tag/Watchforfree (113), watch starts with /y/ (45).
Reach, not a strict sequence: each segment counts sessions that visited that page type, so the sets overlap (a watcher is also counted under home/content). Steps are ordered by size and labelled "% of home visitors"; they are not nested drop-offs. Cross-segment Top-pages confirm the overlap (e.g. of 45 watch sessions, 40 also visited home and 20 the tag).
Time metrics: both Clarity figures are reported per segment — Active time (engaged time) and Total time (full session length). Bots are excluded from Clarity's rates; bot counts per segment are small (14 / 11 / 9 / 4 / 1) and don't change the picture.
Watch tracking:
/y/ pages carry no Play event, so the Play metric (0.64%) is not the watch count; /y/ reach (45 sessions) is the available watch signal.